I’m a big fan of the Breeding Bird Survey – I describe it and comment on it in Chapter 2 of Reflections. I’m also a participant but even if I weren’t then I’d be poring over the annual report as soon as I could each year. And so I had my first look at the recent report when it became available on line yesterday.
Many readers of this blog would enjoy giving it the once over too. It is a model of clarity, of condensing many data into sense and it is generally well-written and looks good.
You’ll find your own particular points of interest, but here are three of mine, although I am interested in all of it.
1. Participation
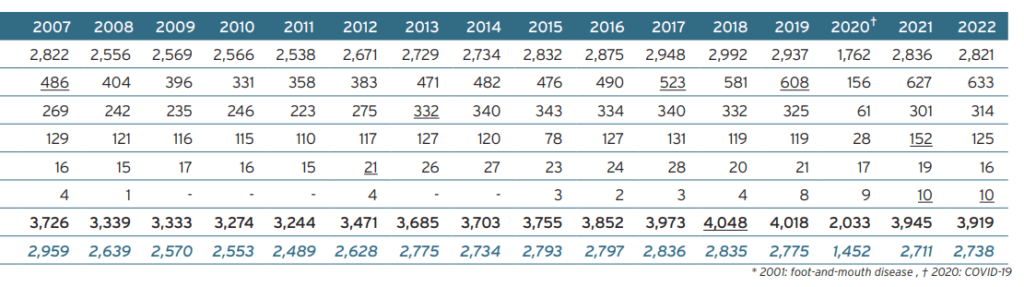
These are just the most recent 16 years of the BBS (which started in 1994) and they show a clear (and expected) impact of covid on participation. Things picked up in 2021 but did not recapture the levels of pre-covid, nor did they in 2022. I’ve been part of the bottom row of numbers, participants, for all of this portion of the scheme and back a few years, and I’ve covered two squares in most years (including in 2020) but last year I just didn’t find the time to do one of my squares (through a combination of bad weather, other commitments (work and play) and simply running out of available dates). And this year the same has happened so I have admitted to my excellent regional organiser that I’ll just do one BBS square in future.
2. Which species is this?
Here is a collection of four fascinating graphs.
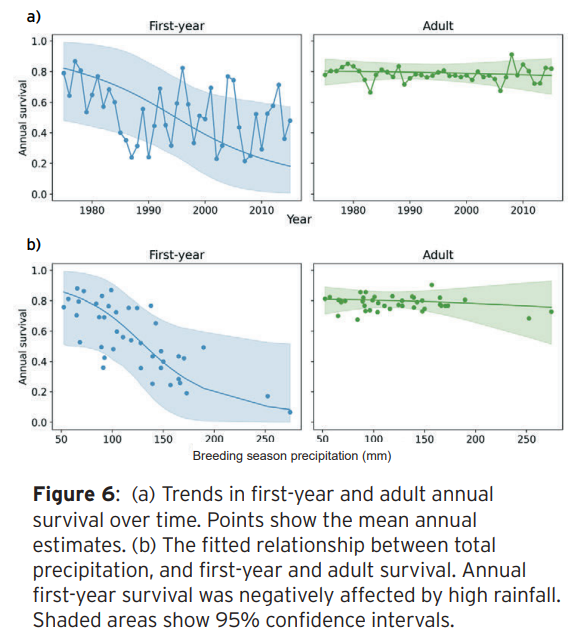
Adult and first-year survival of a bird species plotted against year and rainfall. I wonder whether you can guess the species? I’ll tell you at the bottom of this post (but you can look it up and read the rest of the report by clicking on the links).
At a glance, adults seem invulnerable to summer rainfall but first years aren’t. There also seems to be a steep decline in first year survival over time – graph in top left – according to the fitted line and the shaded area of confidence intervals. And – graph in bottom left – a strong relationship with summer rainfall. Interesting.
But hang on! Look again at the graph in the top left and edit out in your mind the fitted line and the shaded area. What trend do you see? I see a very variable succession of dots but since 1990 they look to me as though they have bounced up and down around a fairly flat line, but during the period 1975-1990 there was steady decline. You can make your own mind up as to whether the fitted line is convincing. Try this – there are 41 points on the graph, of the first 20 of them 1975-1994, 16/20 are below the fitted line – that’s a bit odd, isn’t it? And conversely, of the last 20 points, 1996-2015, 5/20 of them are below the fitted line. Can that be right?
And while you are at it, that data point to the far right of the bottom left graph (with a survival of far less than 0.2) simply isn’t visible on the top left graph – where did it go? Maybe the top and bottom graphs cover different years.
Well, I may have got this all wrong, but you can’t say I haven’t looked at the graphs!
3. Shifting baselines
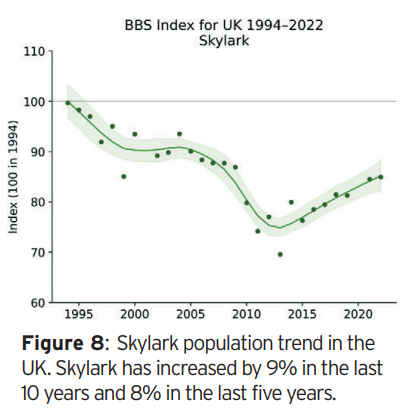
It’s good to see Skylark numbers recovering in the past decade of the BBS even if they are still below their 1994 levels. The BBS started in 1994 so it makes sense to show this graph in this way but let’s not forget that we had quite a lot of data before BBS, and that through magical statistical techniques the old Common Birds Census and the BBS were joined together so we look back a lot further, like this:
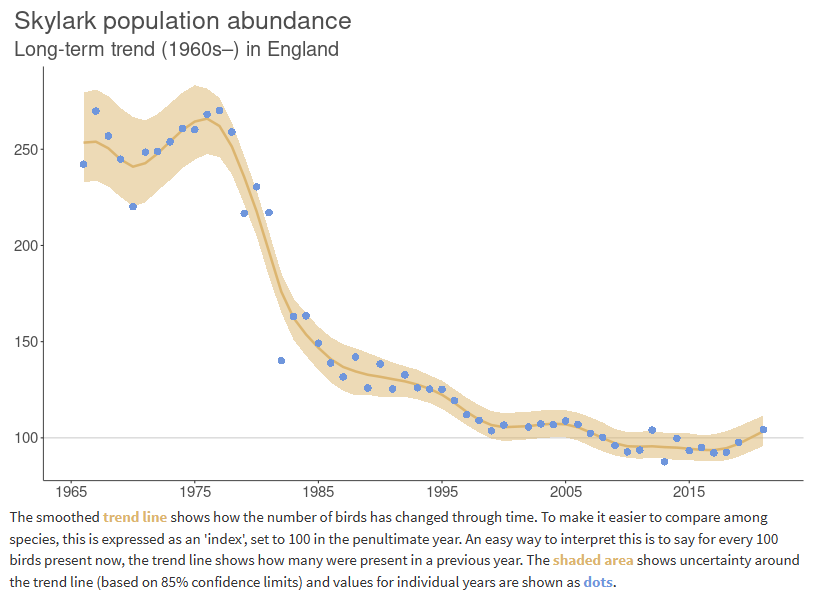
The cheers for the recovery of the Skylark may be rather less muted from those of us who were alive and noticing birds in the 1970s (during which period I first participated in the CBC as an undergraduate).
My grandson may have lived through a period of Skylark increase – but he has only seen two dots on the graph so far – but his mum and dad have lived through over three decades of Skylark decline and his grandparents have seen, and noticed, over five decades of decline. If we didn’t have the data, collected by volunteers, you young people out there would probably not believe how common Skylarks were in the olden days – but we do have the data for birds like almost nothing else. I celebrate the work of the BTO and others to be able us to look back with data rather than with unreliable recollections.
Guess the species – Swift.
[registration_form]