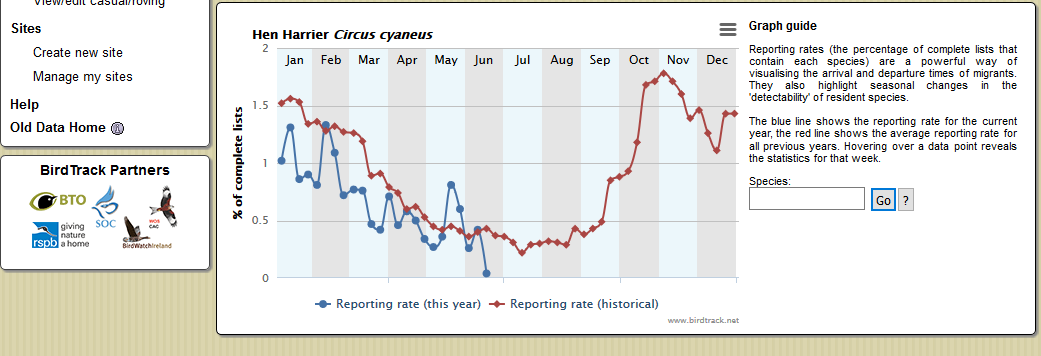
Birdtrack provides this interesting facility where one can look at the reporting rates of any species this year compared with the long term average. Reporting rates are the proportion of complete bird lists (for a visit to a location) that contain the relevant species.
The data from this year ought to be comparable with the long term average unless emphasis has shifted strongly towards recording bird lists in different places or different ways this year. That is possible, since this year, this spring, is a Hen Harrier survey period, but that should lead to relative over-representation of Hen Harriers this year compared with previous years.
There is an interesting blip for two weeks in late May, but aside from that, almost all this year’s points are below the long term average.

No surprise really, and the picture could change (even retrospectively) but some support for the idea that there are even fewer Hen Harriers around than usual this year. I wonder where they’ve gone.
Gunning Wildlife and Conserving Tadpoles said ‘t’s th lck f vwls tht s th cs’ and everybody else said ‘Really? There there! Don’t mention the pole traps‘.
Many thanks to Phil from Birders Against Wildlife Crime for pointing me in this direction.
[registration_form]
Is the blip due to increased observer effort during the survey?
Hi Anand. These reporting rates are the proportion of complete lists featuring Hen Harrier that birders have logged in BirdTrack. This metric is independent of effort; in other words, it’s a percentage of complete lists, so it doesn’t matter how many people submit lists in a given week.
I suspect that weather induced delayed migration of birds that wintered on the Continent (which also affected Montagu’s Harriers passing through) may be a relevant factor, Anand.
Pure guesswork but maybe if the voles were bad in many places they would be moving around a lot looking for the best sites, giving multiple sightings. Not sure how site faithful they are but i presume like Short-eared Owls they are more tied to vole numbers than sites.
Can’t remember where i read it but apparently voles are also the main prey for Tawny Owls hence poor Tawny Owl years. I had always presumed it was mice.
As I said in a previous comment on the lck f vwls. Even in the worst years between colonisation and 2013 there were always nests in Bowland and usually elsewhere their productivity was lower but pairs bred. The truth of the matter is that persecution has reduced the population to such a low ebb. That :- Their are no birds to return to where they bred successfully last year (yes that usually happens in the absence of persecution) and so few other birds that, as suggested by the paucity of sightings to try find a good territory. It is these new birds that will definitely look for sites with good prey densities, but the real problem is a near total lack of birds.
How many birds have found such a site only to fail to attract a mate I wonder or have been killed whilst waiting?
Yes i think you are right.
This year appears to be a pretty poor year for voles where i live but still there are Short-eared Owls. I haven’t been out looking for Hen Harriers recently but now i will.
Just to be clear, Paul, i wasn’t in any way suggesting the weather accounted for a general lack of birds. Rather i was suggesting that the small late spring blip may be (at least in part) due to a bottleneck on the north French coast (caused by bad weather and northerly winds) that delayed and concentrated the (few) birds coming back from the Continent (either to breed or to continue through to Scandinavia) in the same way as returning Montagu’s Harriers appear to have been.
I agree Jim and interestingly I here that what is almost totally absent is adult males. It is males that usually winter “off moor” and often abroad. Perhaps a mild winter encouraged them to stay here with the inevitable consequences. It is also the mild, wet winter that will have exacerbated the vole population crash.
Hi all
There’s a wealth of interesting information summarised in the public outputs on BirdTrack [note CamelCase 🙂 ]. Here are a few points about interpreting the reporting rate graphs that folk may find helpful:
1. Reporting rates are independent of effort. These graphs show the percentage of BirdTrack complete lists that feature a species, so it doesn’t matter how many birders log their lists in a given week (though the more the merrier, of course!).
2. Reporting rates do not account for any bias in observer coverage. Hen Harriers winter in areas (relatively) close to the larger centres of human population, and certainly often in areas that are regularly birdwatched (e.g. coastal marshes). However, they breed in areas that are far less frequently visited by birdwatchers.
The Wheatear reporting rate is another good example of this – in reality, their abundance in UK probably doesn’t drop markedly in June–July cf April–May and August–September. However, most summer records will be from their breeding grounds, whereas spring and autumn see large numbers appearing in ares that are more regularly birdwatched / where there are simply more birders, thus creating two ‘peaks’ in the graph.
3. Between-year variation can account for an apparent drop in reporting during a given year, compared to the historical average. The best way to check this is to plot 3–4 years together, using the new global outputs, to see if the current year looks ‘out of place’.
You can add plots to an existing graph by selecting what you want via the dropdowns, then clicking ‘Add plot’, and you can download the resulting graph as a nice JPEG via the 3 stacked bars menu icon, top right – perfect for sticking into e.g. blog posts and tweets 🙂
4. Any between-year variation is more apparent for species that are only on a small proportion of complete lists (like Hen Harrier, which is only on 1–2% of lists at best). In other words, any ‘noise’ in the data is likely to be amplified in the outputs for scarcer species.
There’s much more to interpreting 40 million (and counting) bird records than I’ve covered here but I hope this helps when thinking about the reporting rate graphs.
BirdTrack is a valuable yet still largely untapped resource. Please do explore the outputs and use them whenever you can. If you’re interested in supporting more detailed analysis of these data, with a particular focus on better understanding the ecology of declining migrants, BTO are currently running a BirdTrack research appeal.
Thanks
Nick
So, with those caveats in mind, what does the graph actually show?
Anyone?