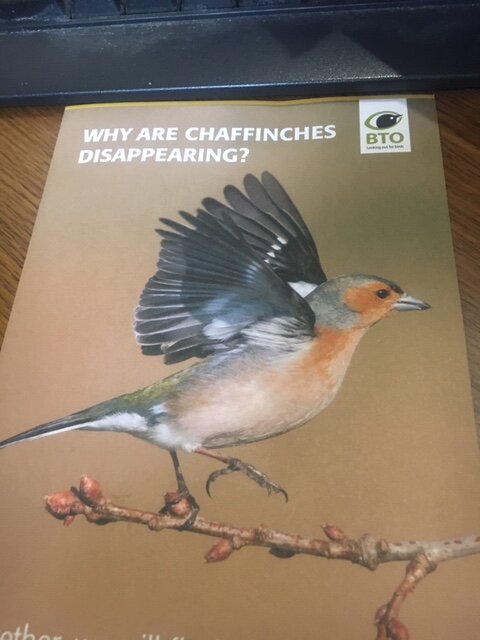
I received an appeal for money from the BTO recently and its subject was the declining Chaffinch. I wasn’t aware that the Chaffinch was declining – they are still a common widespread bird, and just very parochially, if anything they are commoner now in my garden than they once were.
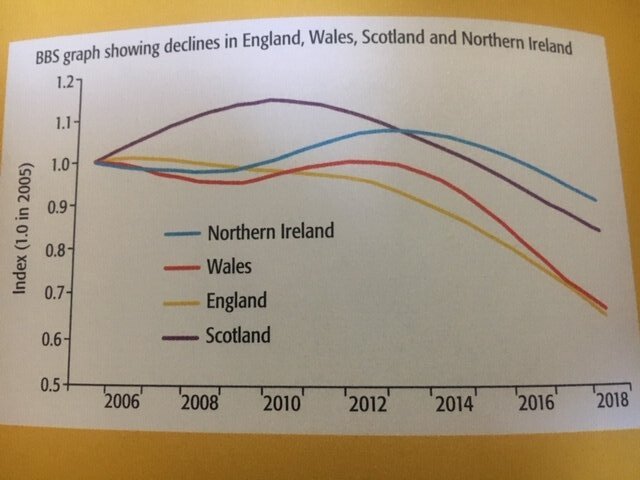
So I looked with interest at the graphs in the leaflet that came in the post.

I’m not terribly keen on this graph, even though it is in bright colours. It certainly shows that there appears to have been a recent decline in Chaffinch numbers in each of the four UK countries, and that’s interesting and relevant. However, most UK Chaffinches live in England I guess, just like most UK people live in England. In fact, 80% of the UK human population lives in England and the England population is ten times that of Scotland (the next largest). So if the above graphs referred to the human population then the UK population graph would look much more like the yellow, England, line than the blue, Northern Ireland, line which is based on a much, much smaller population. So it will be with Chaffinch. One of the many brilliant things about the BTO is that many of the data (admittedly that we collected) are online – and you can check the graphs of Chaffinch population change for the four UK countries and for many subdivisions of England too – click here (and keep reading).
There are two more things about these graphs that I don’t like much. First, I’m not expecting error bars on the graph but I loathe graphs which don’t show the actual, real, data points and just show a calculated smoothed line. It’s the scientist in me, I know, but this is the BTO sending me this information, not Boris Johnson, I’d like to get a better feel for the underlying data.
And second, the displayed population trends don’t go back far enough. The higher, or the more stable, the lines are back to the left, back in time, the more alarming are the recent declines. But again, you can, like I have (but read on), check these out yourself online – click here.
So where I was when I looked at the graph in the leaflet was ‘Hmm. I didn’t realise that Chaffinches were declining, that’s interesting. I wonder what the data really look like. What does the UK trend look like? I guess it looks like the England line in this leaflet but let’s see. And I wonder where the data points are. And I wonder what the full graph, going back a lot more years, looks like. From the displayed material, it looks to me a bit premature to be worrying about the Chaffinch, I’d like to see another year’s data before pressing the ‘donate’ button on this one.’.
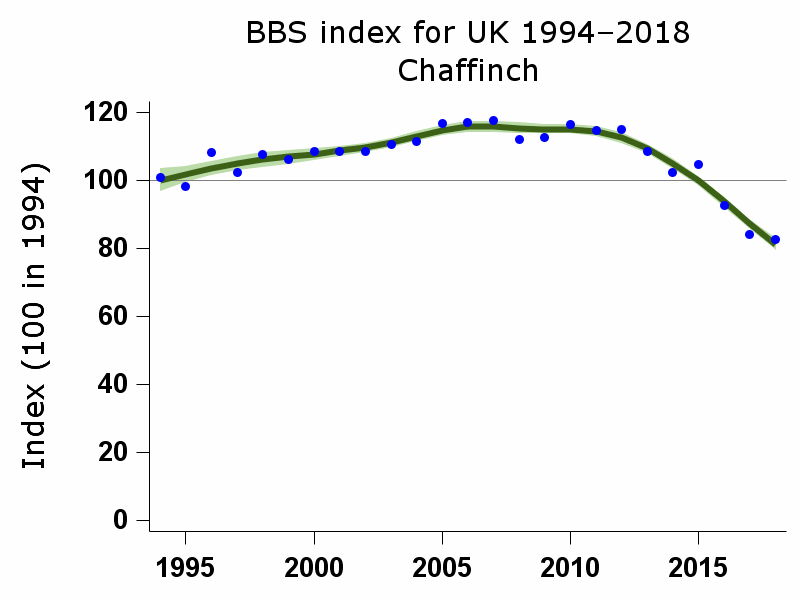
But here is that graph, thanks to the BTO enabling me or you to view it for ourselves;

And so now I’m convinced that Chaffinches are steadily declining, and have been for a few years, and that is after a period of steady increase. Something is going on, and I, like the BTO, am interested to know what it is.
I thought some of the text in the accompanying letter was a bit overblown but this letter in the post made me want to donate, so I have. It was only a donation of £10 because I am conscious of the fact that I seem to be donating to something every day at the moment (and they aren’t all wildlife causes) but the BTO is a wonderful organisation and, actually, I care about the BTO as much as I care about the Chaffinch. And actually, I’m a bit more worried about the BTO at this time than I am about the Chaffinch.
So I made my small donation to BTO general funds and not specifically to the Chaffinch appeal. If you can help the BTO at this time then please do give it some thought.

Chaffinches have certainly declined massively in my garden in West Northants. 15 years ago my feeders would attract constant flocks of 20 plus as well as very large flocks of greenfinches.
These days the greenfinches are long gone and the chaffinches are just one or two.
Happily the house sparrows seem to be recovering a little. There are at least four nests in my house this year up from three last year.
I’ve not seen a chaffinch or a greenfinch in our wild garden on the Wirral for years. But we have a large population of goldfinches.
For what it’s worth, the annual amount of song measured here since 2003 started to decline around 2010. In the last couple of years it has been almost too low to measure in a daily ten minute morning song transect. There also seems to be a change in the relative amounts of song re early and late peaks — in latter years there seems to be much less May song relative to March song.
I was also dubious about whether this would be money well spent. The curve of the graph shows a slow build up in numbers followed by a sudden and fairly step decline. As I think was mentioned in the leaflet, disease would be a good fit. In fact it’s quite difficult to think of another factor that could have caused the same decline, though certainly not impossible that there are other factors involved. It would be nice to know more, but does it justify the spending of £100,000 given all the other priorities? Especially as, if it is disease, there is probably not much that can be done to improve the situation.
Ian – I’d put my money on disease too. I’m investing in the BTO rather than in this project.
Back in 2010 someone from Songbird Survival tried to get me to donate to their appeal to save chaffinches which he said were in decline. He had no data to back that up and seemed more interested in culls of native predatory birds than tackling non-natural sources of decline. I told him of the large flocks of chaffinches we see around here in the winter and declined his offer. Going by your graph he was lying about chaffinches and his appeal had little effect. I joined the BTO shortly afterwards though.
Here in Mid Wales Chaffinch is one of the commonest of birds both in the garden at our feeders and in the immediate wider countryside, Greenfinches are extremely scarce here. A few of the Chaffinches at the feeders appear to be suffering from a Papilloma virus to the point for the odd bird of loosing toes and in one case a whole foot. The same was true of one of the ringing sites I am familiar with in North Yorkshire. However surely Papilloma virus seems an unlikely cause of such a decline.
We saw our first chaffinch with obvious signs of trichomonas infection recently. I agree that we are seeing fewer in the garden overwinter but what’s available in the wider countryside has to be factored in. In mild winters like this year they might not need to use our feeders. Trichomonas wiped out a big proportion of our greenfinches around the time it was first headlined but seemed to leave the other finches mostly untouched then.
Does one dare raise the issue of disease being spread by the widespread pastime of attracting birds to garden feeders? There was a research report a few years ago which suggested that concentrating birds, especially mixed species, in a very limited area might not be such a good idea for their general well-being.
Sandra – that’s why feeder hygiene is very important. We are entering the time of year when food is hardest to find for seed-eaters – I’d keep feeding for a couple of months more. With clean feeders I’d guess that the good you do by feeding outweighs the harm you do by bringing birds together.
Regret that I am not convinced that cleaning feeders makes any substantive difference to the biological mechanisms of disease transmission, added to which many people don’t bother including with those often left unattended on nature reserves.
Around here, Greenfinches seem to be doing well, indeed the most abundant finch. Could it be that they have evolved to cope with trichonomosis? Or perhaps because I am not feeding the birds any more (apart from a rather spectacular Peacock that regularly visits). This is partly because we acquired a cat.
On the subject of graphs, I too get irritated by poor presentation. The one that really irks me is the Birdtrack trend graph of historical reporting rates where they show the reporting rate trend through the year and its “uncertainty range” when I would be much more interested in seeing the historical range of reporting rates so that I can see how any chosen year fits into the historical range.
Whilst concentrations at feeders may well be a real issue it’s always assumed this is a new phenomenon – but what about the rick yards and grain stores of the past, for which modern garden feeding may be some compensation ? There wouldn’t, obviously have been feeders but thousands of birds would be coverin and defecating on the same ground.
I have seen grain heaps on barn floors in Spain where there was as much sparrow shit as wheat. The bread was excellent. Young lads with air rifles shot sparrows from lines of poplars and took them home tied on strings like onions. On enquiring why they were doing that I was told that they were feeding their families. Different world, Vallodolid in 1980.
Fair point, Roderick but we don’t know what the transmission mode is for some avian diseases and it may be nothing to do with droppings or the proximity of birds of the same species. On a personal level, I prefer to err on the side of caution.
Who can hear the bird’s song today on august 2020? Here in Harrogate for the first time I wake up at 4-5 in the morning hearing NOTHING but only the odd crow and wood pigeon. Something in the air is killing trees, insects and birds and I refuse to believe is “climate change” only cause because this change compared from last year is incredibly sad and not organic . I miss the days when I sat in my breakfast room and watch HUNDREDS of birds coming to feed in my small garden, this year in particular I’ll be lucky if anyone comes including bees and the squirrel. Sad times we are facing, next will be us humans to decline. It is time to wake up dich your “smart” devises, the world is sick.