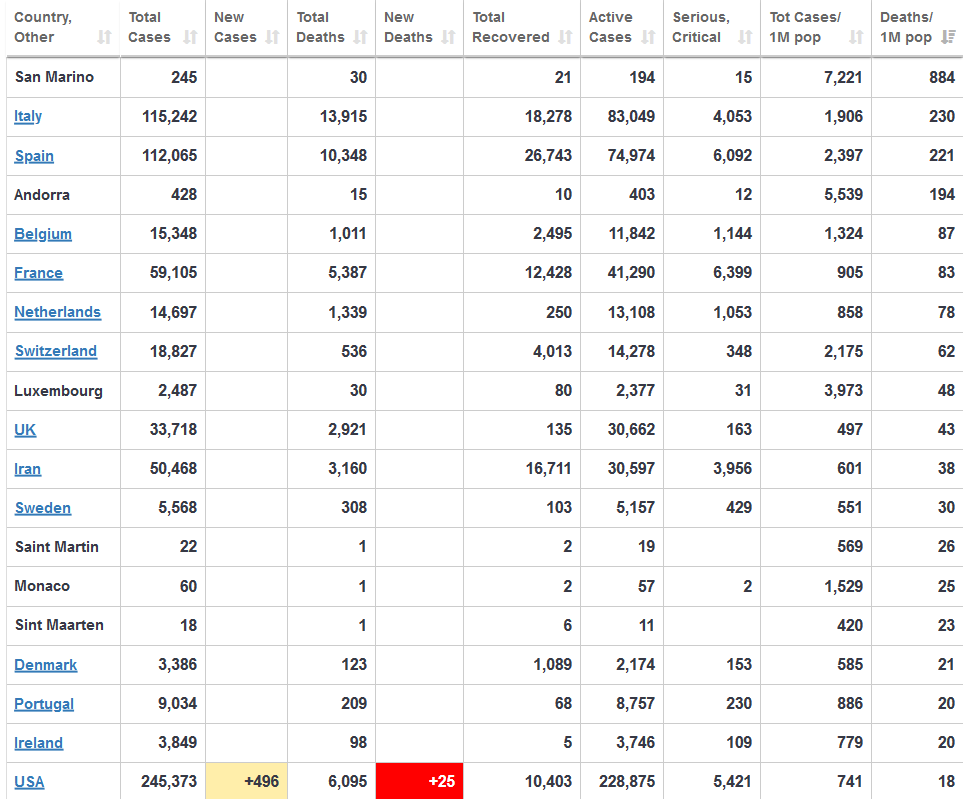
I’ve been looking for a website like this one and a friend in the USA sent me the link. This (above) shows the top of a much bigger table and I have ranked the countries (rows) by their value in the right hand column – deaths/million of population.
Note that already China has dropped out of the top of the table – maybe it will come back, but that seems unlikely. What do you think the value of China is in that right hand column? The answer; 2.
Also note that most of the countries listed are European countries.
And, also realise that as deaths increase the numbers in the right hand column rise, and if a country has a big surge in deaths, as the UK and the USA almost certainly will in the next week, then they will move up the list.
I wonder what this will look like in a week.
Of course, the data will vary in completeness, quality and timeliness.
[registration_form]
I think the most awful table you have ever displayed.
This is for Scotland. It has a comparison with rest of UK of death rates
https://www.travellingtabby.com/scotland-coronavirus-tracker/
Graphs
This is excellent and has a very clever tool for comparing countries
https://corona.help/
Graphs mostly
Two days ago they stopped the graph for infections and kept only deaths!
https://www.ft.com/coronavirus-latest
This is the guy is the one who screamed about the epidemic on 20th January. Ahem.
https://twitter.com/DrEricDing
A few others which are less graphic
https://www.trackthevirus.org/
https://ncov2019.live/data
UK is certainly one of the better ones in cases per million of population. Though we’ve probably done less testing than some countries. We won’t really know which countries took the best measures for a long while yet.
There is a huge concern about what will happen when the Coronavirus infection starts to spread in places in developing countries where many people live in conditions that simply do not permit the kind of social isolation we are trying to practice and where basic hygiene facilities are lacking for many people. The people living in such circumstances also live hand to mouth existences that mean simply staying home is not an option they have.
I believe that the virus is already present in refugee camps created by the Syrian civil war, adding to the hellishness of existence already experienced by those refugees.
The number of cases data is more of an index of testing effort than of disease spread. Every qualified commentator has been saying that the true number will be at least x10, but how many beyond that appears to still be almost entirely speculation and will vary (probably by orders of magnitude) between countries. And that’s without even factoring in any deliberate manipulation of the data (N Korea… Russia… etc).
Also there’s the issue of how the death rate is made up; how many otherwise healthy people have been killed, in how many did the virus hasten an already inevitable end, in how many did it tip a survivable pre-existing illness over to lethality, plus the missing number of how many people have died of other quite unrelated causes which in normal times could have been saved had the hospitals not been swamped with cv patients.
Plus we must ask is the number just hospital deaths or a true total? and what is the delay between date of death and date when the death is added to the statistical total (can be up to a week or so esp for non hospital deaths)?
Hence the repeated guidance from the CMO and others that comparisons between countries are very problematic; indicative at best but not quantitative. The different national data sets are simply not directly comparable.
We can however probably assume that any error or bias in the data *within one country* is consistent over time – so the shape of the lines is a genuine measure of the disease progress within that population. The bad news is these lines are mostly still upwards, the very good news is that none of them appear to be anything like the exponential nightmare of a worst case scenario. But when the disease hits developing countries that might change.
Meantime I saw a lovely pair of treecreepers a couple of days ago. Made my day and lifted my mood.
jbc – yes indeed. But it will still be interesting to see what it looks like in a while.
Well done on your treecreepers – they are special aren’t they.
Ah. Belay my last. A facebook friend has pointed out that the graphs we’ve all been looking at, the ones showing death rates, have a log scale. So the “very good news” I mentioned above is… not so good after all. Sorry for my error, sooner corrected the better. Though I can’t help wondering if HMG is using a log scale hoping that people won’t notice, or if they do won’t understand what that means.
ps – on the same walk I also saw a pair of dippers!
There was a Channel 4 clip where a doctor explained that without measures the infection rate of flu is 1.3 per person and so after 10 levels of infection they in turn infect a total of 14 people. Then he explained that for Covid-19 one person infects 3 and so after 10 levels that is a total of 59,000 people.
I tried doubling those powers
1.3^20 = 190
3^20 = 3,486,784,401
Wow, then i wondered how feasible ^20 is.
I looked at the USA flu in 2017.
That killed 61,000 so even if that flu had a 100% mortality rate it would have required a 1.3^42 to get to 61,000 infections never mind deaths. Flu has a 0.1% mortality rate so it was way, way more than that and because of natural immunity multiple times more.
So then back to Covid-19, since ^42 is perfectly feasible.
3^42 = 1094189890000000000000000000000000000000000
which could infect the whole world’s population 14 billion times over. I double checked this but maybe i am a idiot…
Of course there are many other limiting factors but this very crudely illustrates pandemic spread with free movement of people.
The reason Dr Eric Feigl-Ding freaked out was the infection rate as above, the mortality rate and it being asymptomatic.
Even with flu like mortality rates of 0.1% this would be a disaster and Covid-19 is thought to be 2-3%.