This is Lead Week on this blog.
This is a blank graph – but tomorrow, at 6am, you will see it populated with data. There will be 40 points on this graph – each one a sample of Red Grouse meat bought from Iceland Foods stores showing its measured lead content.
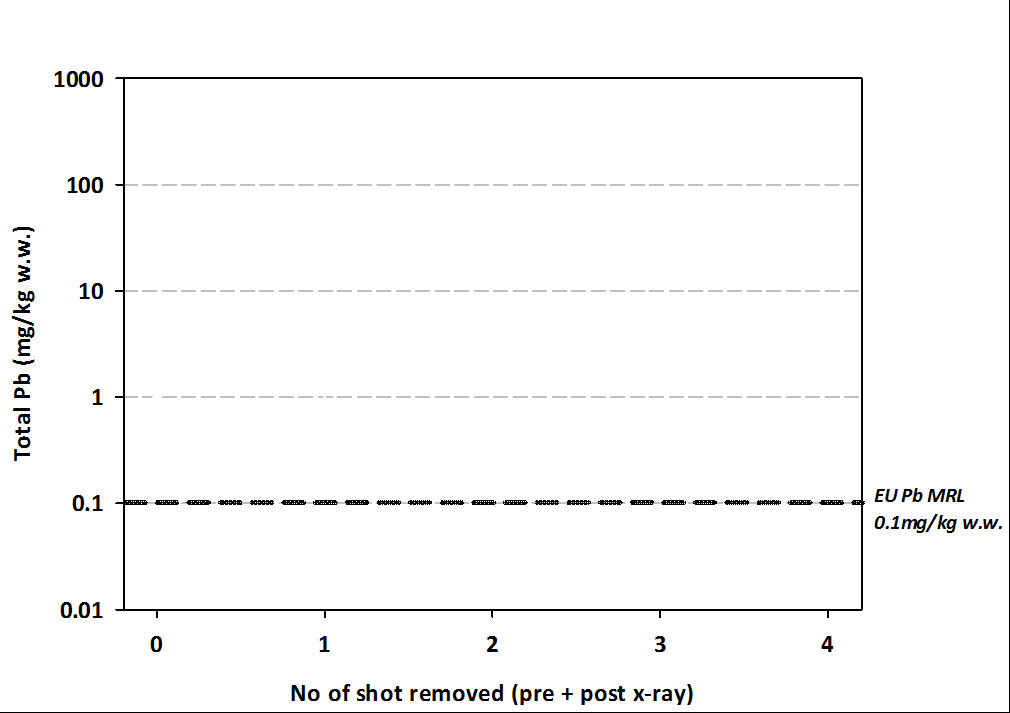
I thought that explaining the graph before you see the data might be helpful.
This will be, when the data are added, a graph of how much lead was found in each of 40 Red Grouse bought in Iceland Foods supermarkets. The Y-axis shows the lead levels in mg/kg w.w. (milligrammes ie thousandths of a gramme of lead in kilogrammes of grouse meat (wet weight ie before dried for analysis)). Have you got that? milligrammes Pb/ kg undried meat.
Now 1 mg/kg is one part per million (1ppm) because there are 1000mg in 1g, and 1000g in 1kg.
The horizontal dashed line represents a lead level of 0.1mg/kg – that is the EU maximum lead level (MRL – maximum residue level) that meat such as beef, pork, chicken, turkey, lamb etc is allowed to contain. Higher levels would be illegal, because eating lots of lead is a bad idea for our health.
The MRL is set for meats such as beef, pork, chicken etc but not, rather strangely, for game meat. If you were to sell beef which had a lead level above 0.1mg/kg it would be illegal. Just to be clear, it is perfectly legal to sell game meat above this level; indeed as far as I can tell, you could sell game meat with any level of lead in it and it would be legal. You could, perhaps, even sell a lump of lead and label it as grouse meat and it would be legal.
And just for clarity again – that’s what I am aiming for here – 0.1mg Pb/kg w.w. is one tenth of a ppm, which means that it is 100 parts per billion (100ppb) which means that you can compare these data with those in Pain et al. 2010 which use 100ppb throughout). In other words, 0.1mg Pb/kg w.w. is the same as 100ppb w.w..
The Y-axis is on a log scale – lots of people started to hate Maths at school when they encountered logarithms, but they are actually quite useful. You’ll see how useful this method of presentation is when the points are on the graph, but for now just notice that the dashed line is at 0.1mg PB/kg ww and the next notch up on the Y-axis is at 1mg Pb/kg ww – tens time higher, and then the next is at 10mg Pb/kg w.w. – 100 times higher than the dashed line. So, being a little bit further up the graph is actually having a lot more lead. If there are any points in the top bit of the graph, between 100mg Pb/kg w.w. and 1000mg Pb/kg w.w. then those samples, if there are any, will have between 1000 times and 10,000 times the lead levels that would be illegal in beef, pork, chicken etc. Now, that would be a very high level of lead for Malcolm Walker’s Iceland Foods to be selling you, wouldn’t it?
And lastly, the X-axis uses the number of shot removed from the carcass. How much do you think the number of shot found in the game meat will tell you about how much lead there is in your meat? We’ll see.
[registration_form]
Is it worth making clear (unless I missed it) that, despite the presence of the two things on the same graph, it’s the Lead levels, *post removal of the shot*, that has been measured? I know you made it clear in your methods summary but some people will only read the results.
Dr m – that’s a good point. Thank you.
my pleasure!
Don’t suppose they could extract any medicated grit residues from the same samples? Would be good to know if there was another reason for not eating this stuff.
Common Mark… you are going to have to get sound enabled on this blog. You need to accompany all these cliff hangers with the classic EastEnders Duff duff duff…….