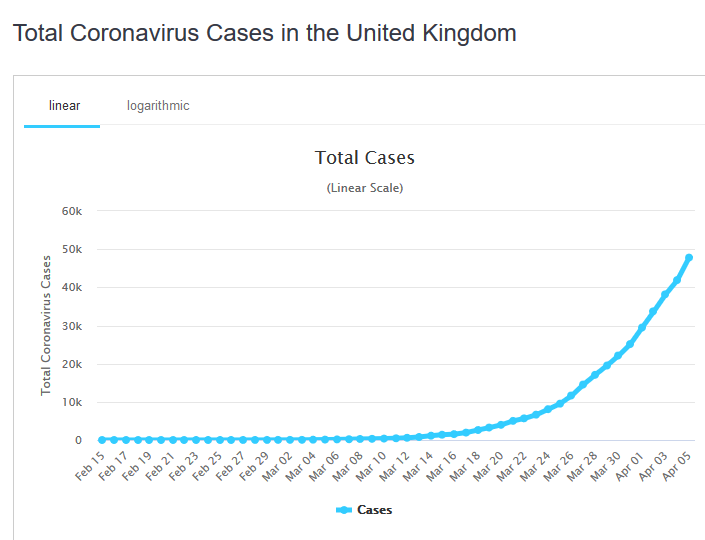
Last week:
This week:
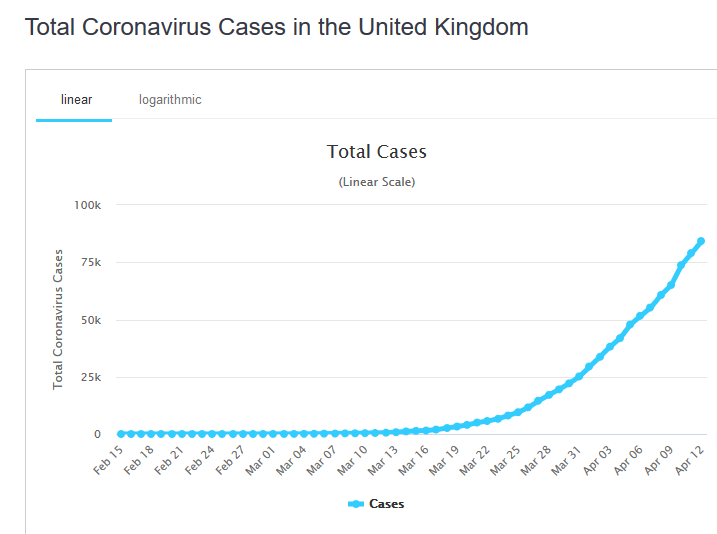
It’s still an utterly beautiful yet terrifying curve. In a week it has increased from 48,000 cases to 84,000 cases. The first case in the UK was in early February, about nine weeks ago.
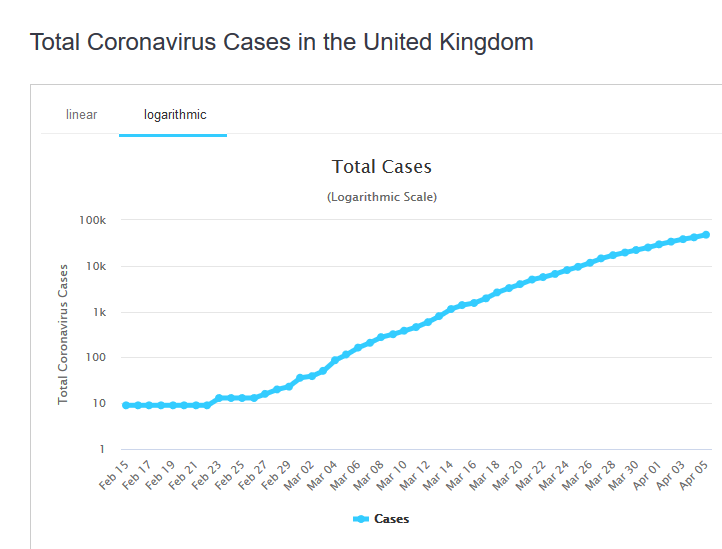
Exactly the same data on a log scale, a week ago:
And on a log scale, now:
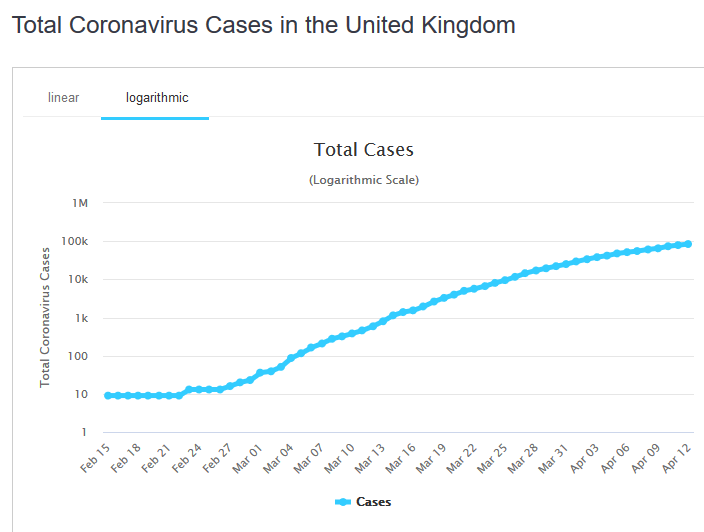
The log scale makes it look as though we are already at 100,000 cases but we are on 84,000 – but each of the last 5 days has seen an additional 4,000 -8,000 cases (round numbers) with an average of over 5,000/day.
And this from 10 days ago, ranking countries by their deaths/million population:
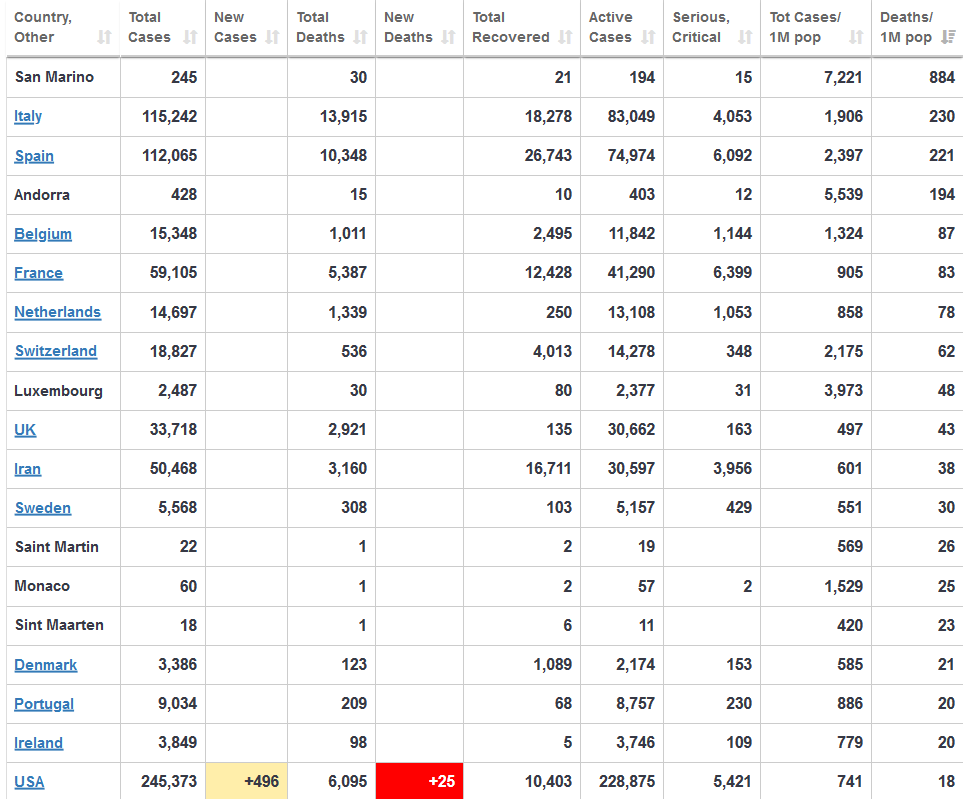
And now:
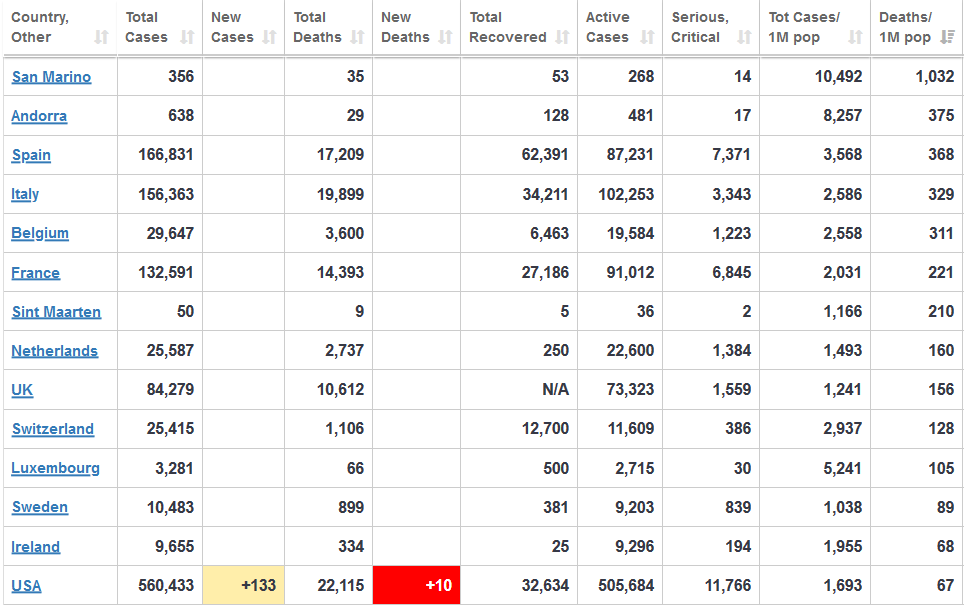
Ten days ago, the UK had experienced 43 deaths/million population, now the figure is 156 deaths/million population. Where do you think we will be in another week? The lag between getting COVID-19 and death (obviously most people recover) can easily be two weeks, so the lag between cases and deaths can be as much as two weeks.
By the way, China is still saying that it has had 2 deaths/million population.
I have yet to find a source for the current number of infective cases – the “total” curve includes every case on the timeline but a high proportion has recovered and as of yesterday there were 227 cumulative confirmed cases (not deaths) in Wiltshire (excl Swindon, PHE) but we are not told where those cases originated or how many are recovered and as there is only a miniscule chance that they were all under the blue dot at the centroid it is no help in weighing up your chances of walking into a small cloud of infected snot not that that matters perhaps as we aren’t s’posed to be going anywhere especially the Dumb Cluck who actually knocked on our front door to ask the way to Salisbury on a long distance path where if you started in Winchester you keep going and if you started in Salisbury you turn around and go back the way you came
I’ve spoken to quite a few people now, including doctors and nurses, who have suggested that the virus was in the UK well before than the first confirmed case. Members of my family, who had all had the seasonal flu jab, had the symptoms around Christmas time. Maybe it was just a different bug but personally I think most of the graphs show an inaccurate picture of events. The lack of testing also doesn’t help the accuracy of the figures.
Dave – I agree that the figures will almost certainly be somewhat inaccurate, and different countries have different systems of including cases etc. But I don’t think those make much difference to the big picture at the moment, and almost certainly won’t after another few weeks.